Where does all of the work go from the layers that AI took out of the org chart?

Removing a layer of management is the easy bit, but working out “who does what now?” is where a lot of restructures come unstuck.
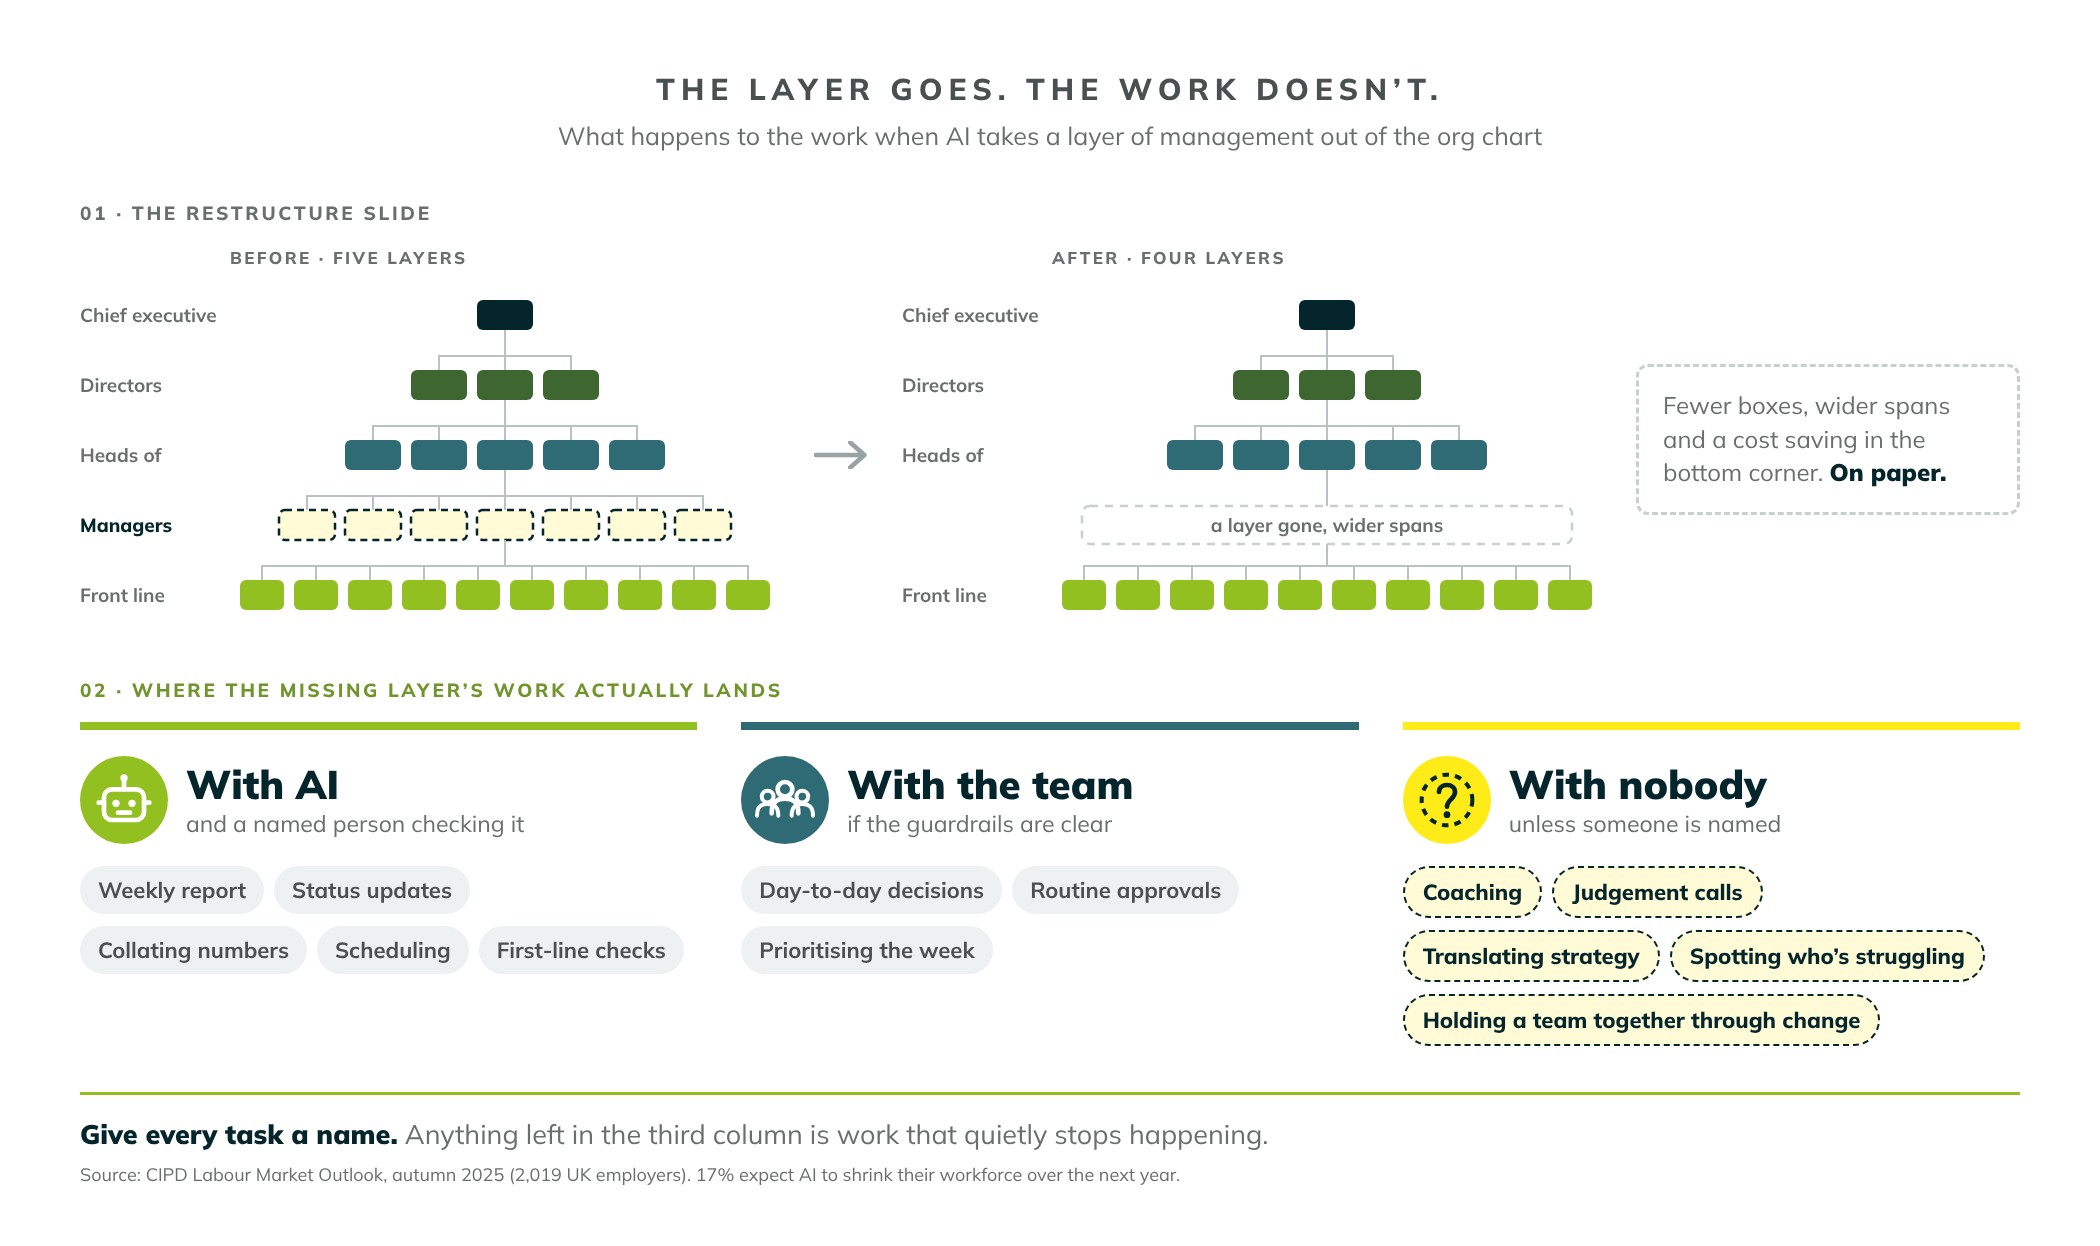
Most restructure decks have a slide that sets out two org charts side-by-side and gives you a ‘before’ with five layers between the chief executive and the front line, and the ‘after’ with four (sometimes three), with fewer boxes, wider spans of control, cost savings listed in the bottom corner, and a satisfying slide to look at. On paper.
AI has made that slide a lot more common; one in six UK employers (17%) told the CIPD last autumn that they expect AI to shrink their workforce over the next year. Of those, almost two thirds (62%) said the roles most likely to go are clerical, junior managerial, professional or administrative. The middle and lower-middle of the chart is where things are disappearing, which is also interestingly enough where most of an organisation’s coordinating, checking and reporting gets done.
What does the ‘middle layer’ do?
The case for flattening an organisation isn’t daft. A good chunk of a manager’s week goes on moving information up and down the business, with things like the weekly report, the status update, pulling numbers together for the layer above, checking work before it’s signed off and chasing approvals all forming part of their remit. AI can do it and it is getting better quickly.
The Chartered Management Institute’s June report shows how far things have already moved, because they state that 70% of managers say they now go to generative AI for advice rather than to their own manager, because it’s quicker and goes into more detail. If the people in your middle layer would rather ask a chatbot than ask their boss, it’s a fair question to ask whether the layer above them is worth being there.
But that’s only half the job. The other half rarely makes it onto a job description, whether that’s turning a strategy into something a team can act on by Monday morning, making a call when the data doesn’t give a clear answer, noticing the person who’s struggling, or keeping a team together through its third change programme in two years. These intangibles don’t show up in an organisation chart, and that means they also go missing from the restructure plan as well.
"You can delete a layer from a spreadsheet in an afternoon, but the work it did doesn’t disappear too – it just hits somebody else’s desk without a person responsible listed"
The people picking it up aren’t always ready for it. The same CMI research found only 12% of managers feel ‘very confident’ leading AI-enabled teams. So the plan in a lot of organisations is fewer managers, running bigger teams of people and AI agents, with less preparation than they’ve ever had.
‘Tired of constant transformation’
We’re aware of the irony of writing this in a series called The Age of Continuous Transformation, but Investors in People found that 47% of middle managers say they’re simply tired of constant transformation and only 14% feel energised and ready for change. These are the same people being asked to carry the next restructure, and in some cases to design their own role out of it.
Our view is that the tiredness has less to do with the amount of change and more to do with how it arrives, as a run of separate events: an announcement, a consultation, a new chart, a settling-in period, and then the next one. It’s the model we questioned in the first article in this series (transformation with an end date), and flattening by restructure is about the purest version of it. In the UK it’s also getting more expensive to get wrong, because the maximum protective award for failing to consult properly on collective redundancies doubled on 6 April 2026.
HR leaders can see this coming. In our Convergence Agenda research with 101 senior people leaders, 44% put transformation and change in their top three challenges, and roughly one in five are redesigning their operating model outright. Among delegates registered for our 2026 programmes, workforce planning (38%) and change management (37%) are two of the biggest areas of investment.
Start with the work, not the chart
In Part two of our series we set out the continuous transformation loop: read the shift, redesign the work, plan the mix of people and AI, then design the organisation around it. Org design is the step that closes that loop. In practice, that means doing the unglamorous bit before anyone draws a new chart, i.e. listing what the layer actually does, task by task, and sorting it into three piles:
- Automate. The reporting, collating, scheduling and first-line checks. AI does the work and a named person checks what comes out.
- Hand over. Decisions that can sit closer to the work, with clear guardrails, so a team isn’t waiting on sign-off from someone two layers away.
- Keep. Coaching, judgement, translating strategy and leading people through change. This is the human part of management, and after a restructure it needs more investment, not less.
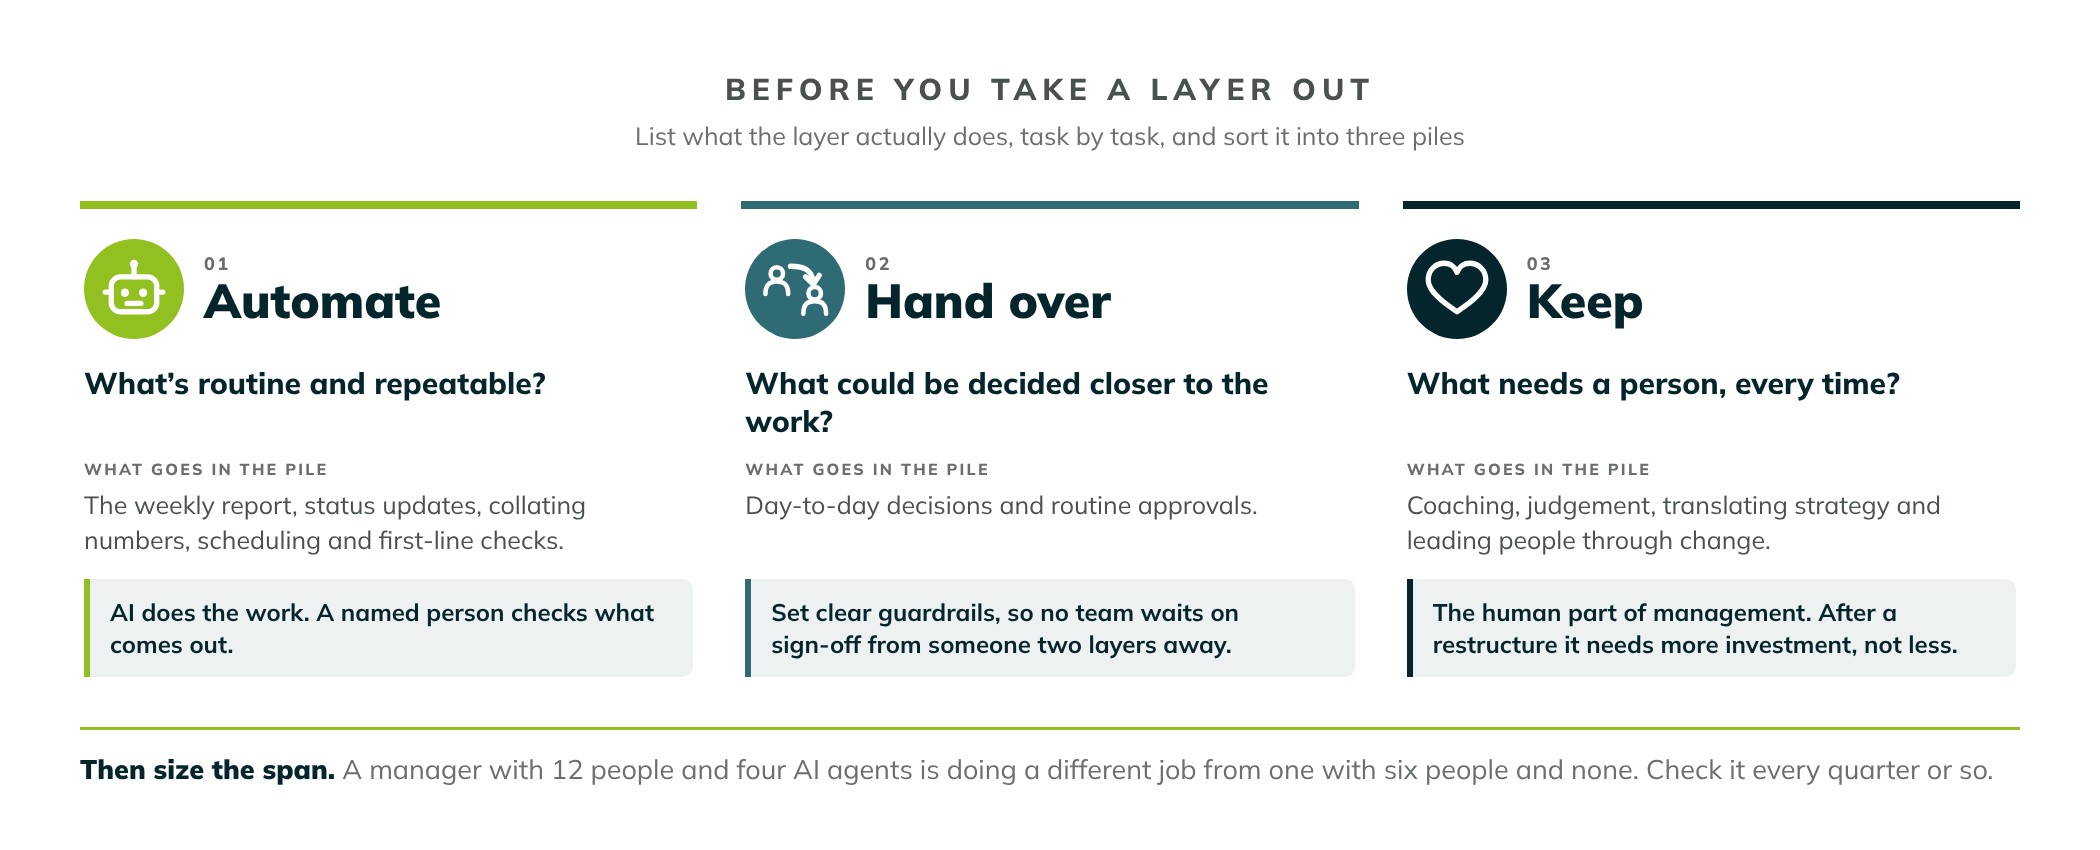
Only then do you size the new spans. A manager with 12 people and four AI agents is doing a different job from one with six people and none, and the role, the training and the pay should reflect that. Then you check it every quarter or so rather than redrawing the whole chart every three years.
As we put it in the first blog, change the jobs and you’re redesigning the organisation; redesign the organisation and what you need from your managers changes. That’s where Part six picks up next Friday.
Taking it into the room
Org Design & Workforce Strategy is one of the seven pillars at Working Futures on Tuesday 24 November in London, with PTHR as its stream partner. Its five sessions take these questions on directly, from designing teams of people and AI agents to making change stick without wearing people out.
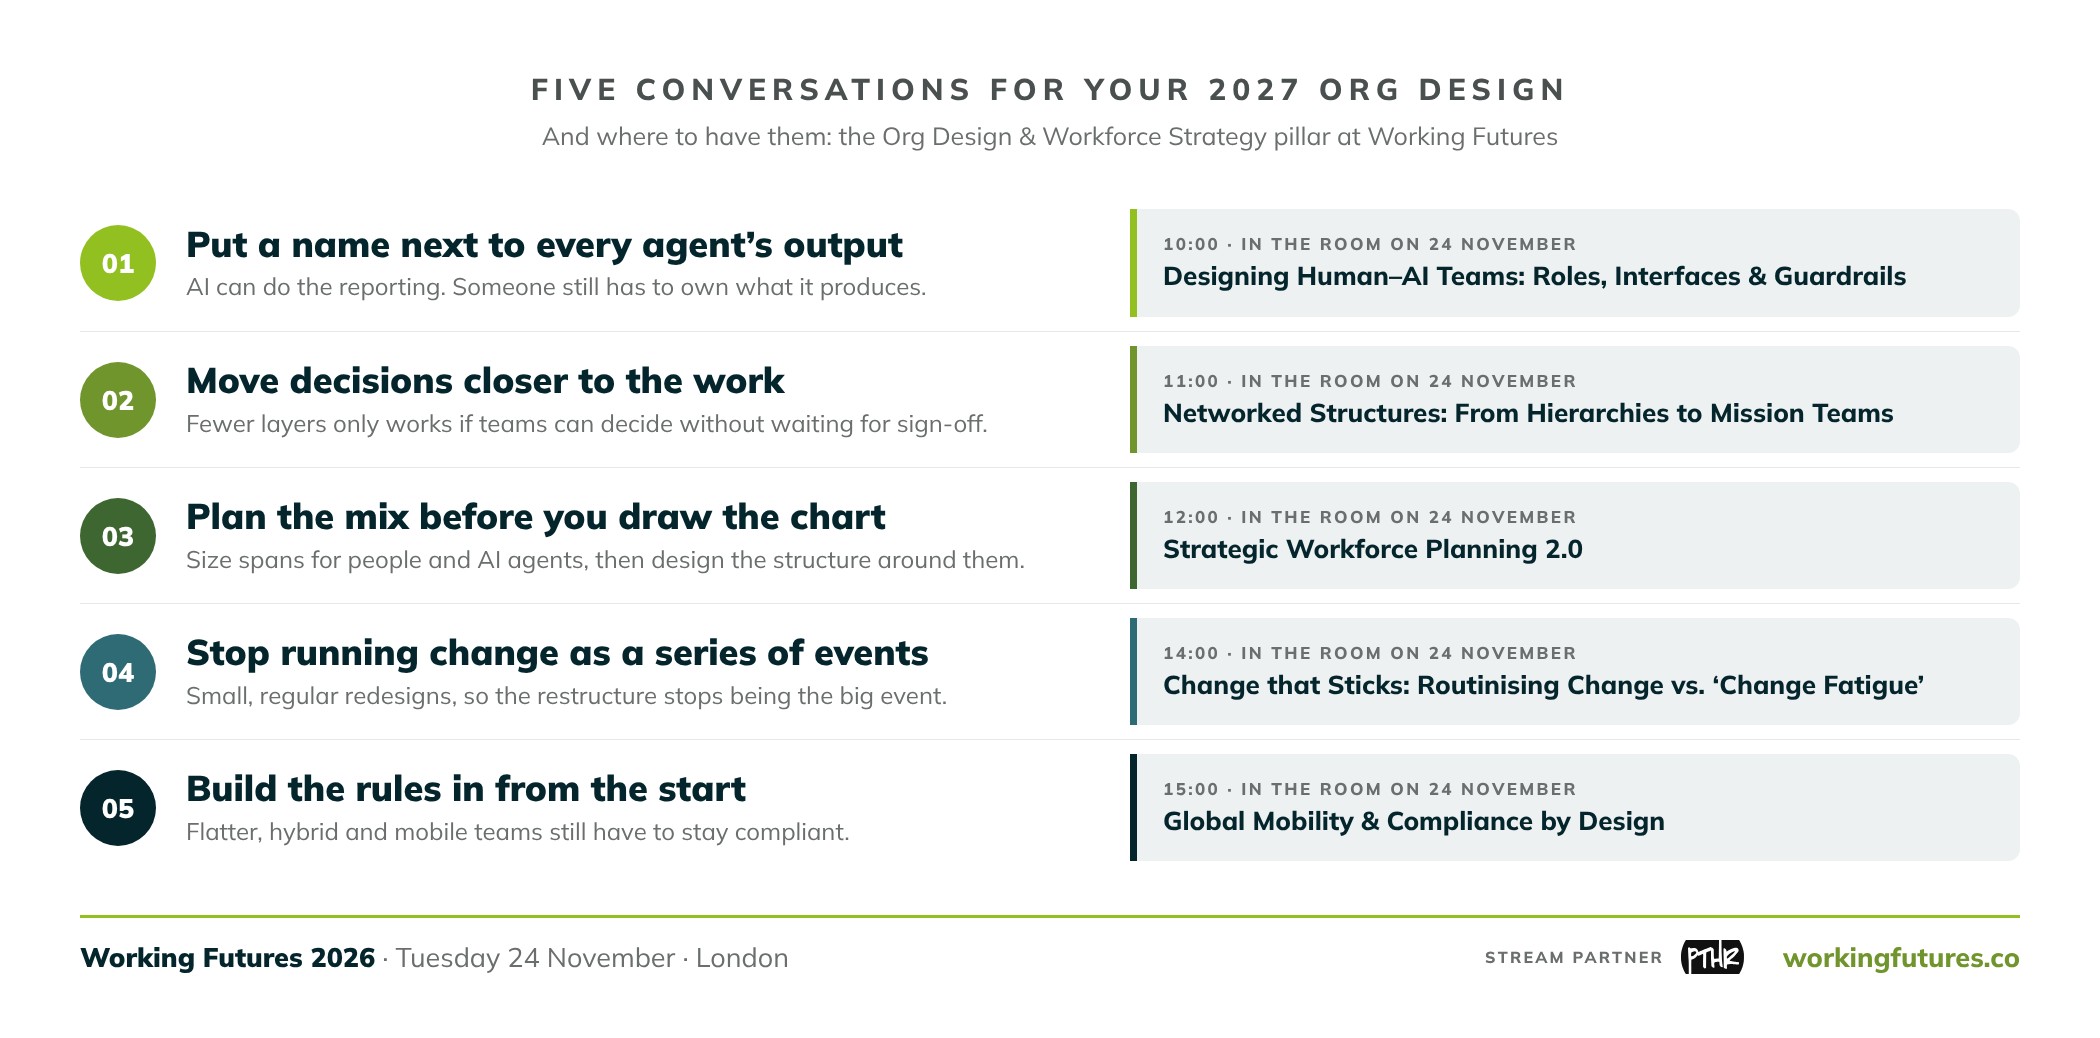
We’ll be taking all five into the room on the day. Register your interest here.
Part 5 of The Age of Continuous Transformation, our eight-part series in the run-up to Working Futures on Tuesday 24 November 2026. Read the full series →